I’ve been digging into on EB visas data analysis lately and wanted to share a few interesting insights.
The data is available here: https://www.iterguide.com/ —— one section tracks application numbers and green cards issued per million people over the last two years, covering all EB-1 to EB-3 subcategories. Some countries stand out in EB-1, like China and India, which consistently top the application charts across all EB-1 subcategories. But their situations seem to differ somewhat.
Start with China EB-1
China leads in both EB1A and EB1B applications, and coming in second in EB1C (see Fig 1-3). EB1A alone makes up about 70% of China’s total EB-1 applications—clearly the preferred route. What’s more, in the first five months of FY2025, Chinese applicants received 1,976 EB-1 visas, which might which might hint a faster processing lately.
So what are these people doing once they arrive? Nearly half go into research and academia, especially in cutting-edge field like AI, big data, and cloud computing — many as senior engineers or university professors. A good number also start their own businesses, particularly in the tech startups.
India’s EB1C
India’s story is a bit different. As you can see in Fig 3, India submitted 3,392 EB-1C applications — way ahead of China, which came in second with just 780. EB-1C actually makes up around 53% of India’s total EB-1 applications over the past two years.
Indian talent has made a massive impact in the U.S. tech and engineering — about 27% of executives in Silicon Valley’s tech giants are of Indian origin. Across Fortune 500 companies, over 30% have Indian-born executives, and among those, 96% hold bachelor’s degrees and 74% have a master’s or PhD. Many bring solid management skills and adaptability in complex international business environments, making them key players in American tech.
Salary-wise, Indian applicants typically see a huge boost—2 to 5 times their previous income—and earn more than other ethnic groups on average, which makes it even more attractive.

Fig 1: EB1A Applications by Country Last Two Years (Screenshot from IterGuide AI)

Fig 2: EB1B Applications by Country Last Two Years (Screenshot from IterGuide AI)
Looking Beyond Just Numbers
But looking only at total applications doesn’t tell the whole story. Some smaller countries really shine when you check the the green cards issued number per million people. Take Israel, for instance — it ranked first across all three EB-1 subcategories (see Figs 4-6): 8.33 for EB-1A, 1.75 for EB-1B, and 13.06 for EB-1C. That’s likely tied to their strong education rates and R&D spending — with less than 10 million people, Israel spent 4.3% of its GDP on R&D investment in 2024, leading the world for 15 years straight (that’s twice China’s rate and 1.5x the U.S.).
Also, 1 in 12 chip designers worldwide is from Israel. No surprise that around 70% of the 8,300 high-tech professionals who left Israel in 2023–2024 moved to the U.S., with many entering biotech, pharma, and digital health industries here.

Fig 3: EB1C Applications by Country Last Two Years (Screenshot from IterGuide AI)

Fig 4: EB1A Issued Number Per Million People by Country Last Two Years (Screenshot from IterGuide AI)
Venezuela’s Surprising EB1A Performance
Venezuela is another surprising case. Over the past two years, it ranked second in EB-1A issuances per million residents (687 per million, Fig 4). The reasons here aren’t quite the same, largely influenced by the country’s economic and employment situation. With average monthly household income around $875 and basic living costs near $500, the gap has prompted many skilled professionals seek opportunities abroad via EB-1A. About 40% of those who make it to the U.S. go into self-employment or startups, particularly in tech and arts, with strong income potential.
Other Influences: International Relations
Beyond domestic conditions, international relationships also shape talent flow. Canada, for example, ranks second in EB1C issuances per million (737 per million, Fig 6), which may reflect close U.S.-Canada trade and economic ties. A small survey from January 2025 even suggested 4 out of 10 young Canadian are willing to gaining U.S. citizenship.
Behind every number is a real person making a choice.
If you want to dive deeper into data for different countries or categories, feel free to check out the data source at https://www.iterguide.com/ .
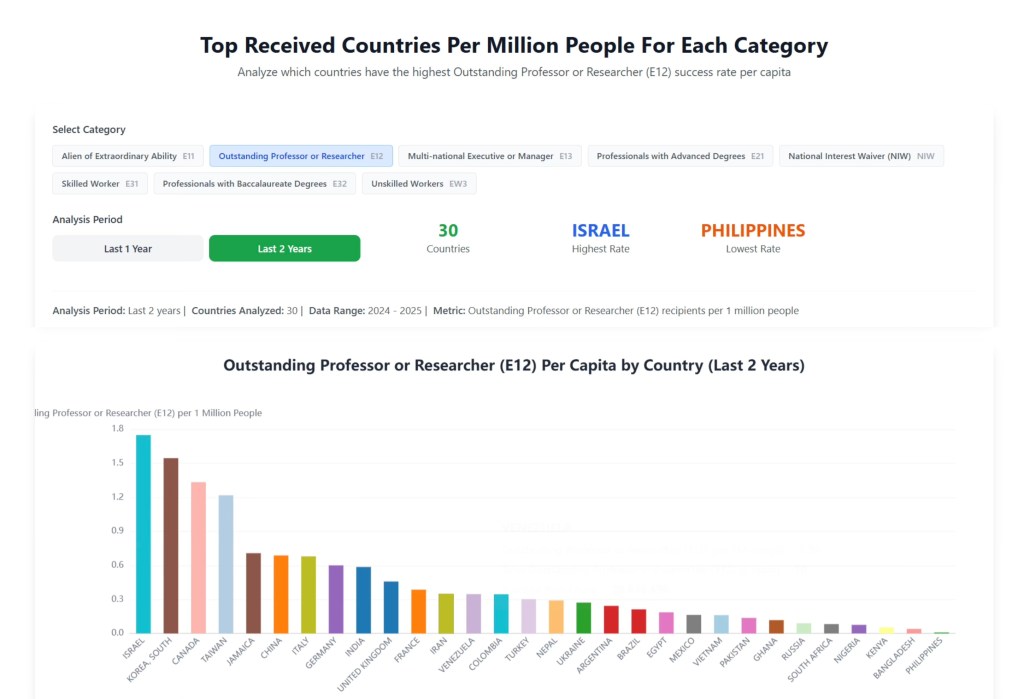
Fig 5: EB1B Issued Number Per Million People by Country Last Two Years (Screenshot from IterGuide AI)

Fig 6: EB1C Issued Number Per Million People by Country Last Two Years (Screenshot from IterGuide AI)
